Great (Home Price) Expectations
Every quarter for more than 12 years, at least 100 members of an expert panel managed by Pulsenomics participate in the Zillow Home Price Expectations Survey to predict the 5-year future path of U.S. home prices and weigh-in on topical concerns pertinent to residential real estate and mortgage markets. In every year since the survey’s 2010 inception, Pulsenomics has recognized the most accurate forecasters with one of its coveted Crystal Ball Awards.

The audience for this survey–housing policymakers, risk managers, real estate and mortgage industry stakeholders, professional and academic economists—continues to grow. Here’s why:
The survey response data are unique and compiled from a large, diverse panel of subject matter experts.
- The survey response data set includes more than 100 authoritative, independent perspectives on the future path of U.S. home prices.
- Panelists share their year-by-year home price expectations over a five-year horizon.
- Experts supplement their home value forecasts with their opinions on topical issues pertinent to the U.S. housing and mortgage markets.
- The survey data are updated and published in a standard format every quarter, and freely accessible online.
- We’ve compiled more than a decade of historical expectations data and performance reports.
Particularly during these times of elevated market volatility, multi-year forecasts and objective viewpoints compiled from numerous experts deliver valuable independent perspectives that can help inform business plans and risk management policies.Â
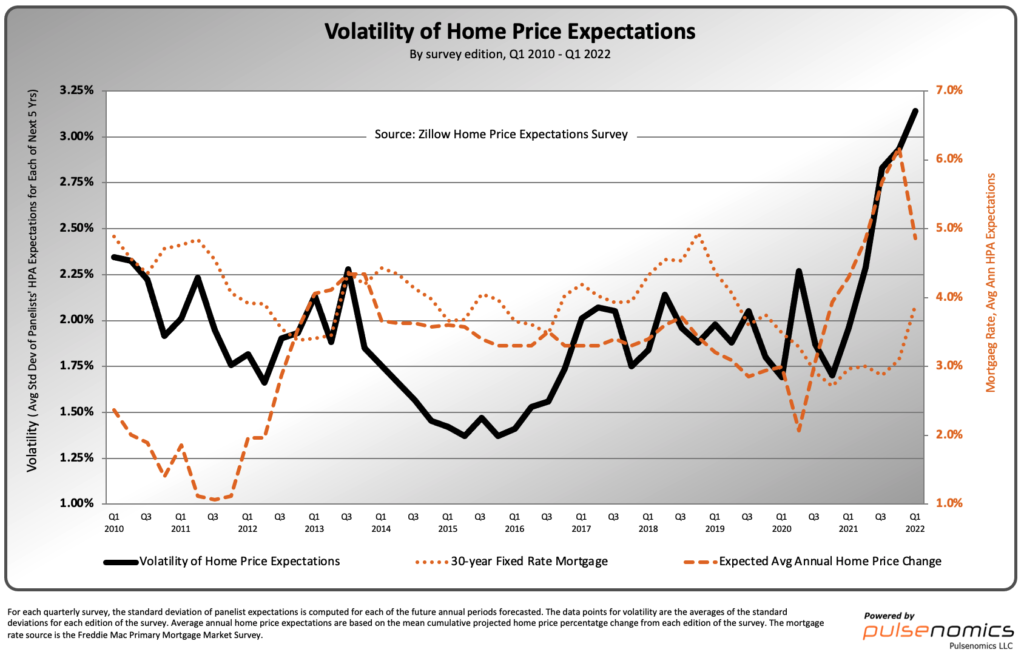
- While the public health threat of Covid-19 may have begun to fade, the toll on housing fundamentals persists. The sudden onset and profound impacts of the pandemic, coupled with unprecedented government policy responses, made economic forecasting especially challenging during the past two years. Unsurprisingly, the volatility of home price expectations has soared to record levels.
- During the first half of 2020, virus contagion, widespread business closures, and eye-popping unemployment surges were widely expected to force home values lower. Ultimately, the combination of massive government aid programs, accelerated development of FDA-approved vaccines, record-low mortgage rates, surging demand for less crowded living spaces, and rapid, widespread acceptance of WFH (work from home) arrangements created an extraordinary shift in housing preferences.
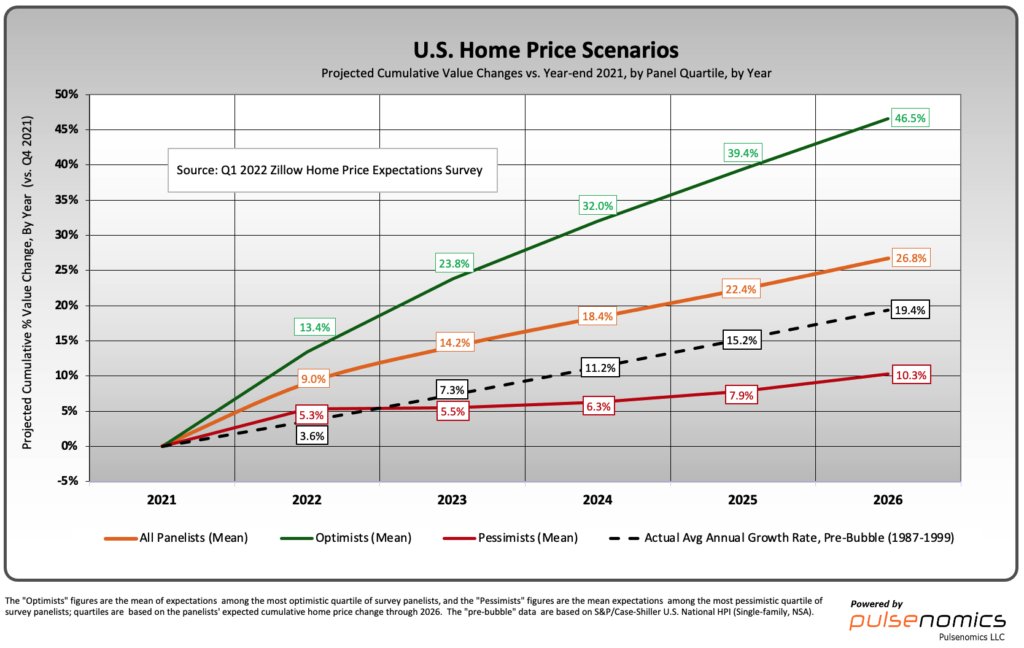
- Collectively, the latter forces stoked demand for single-family homes, home offices, and open spaces in a supply-constrained market. One result: nationwide, U.S. home values soared by nearly 30% during the last two years (2020 and 2021). Most of our panelists now expect robust home price appreciation to continue in 2022—the mean forecast among 109 expert respondents in our most recent survey is 9%.
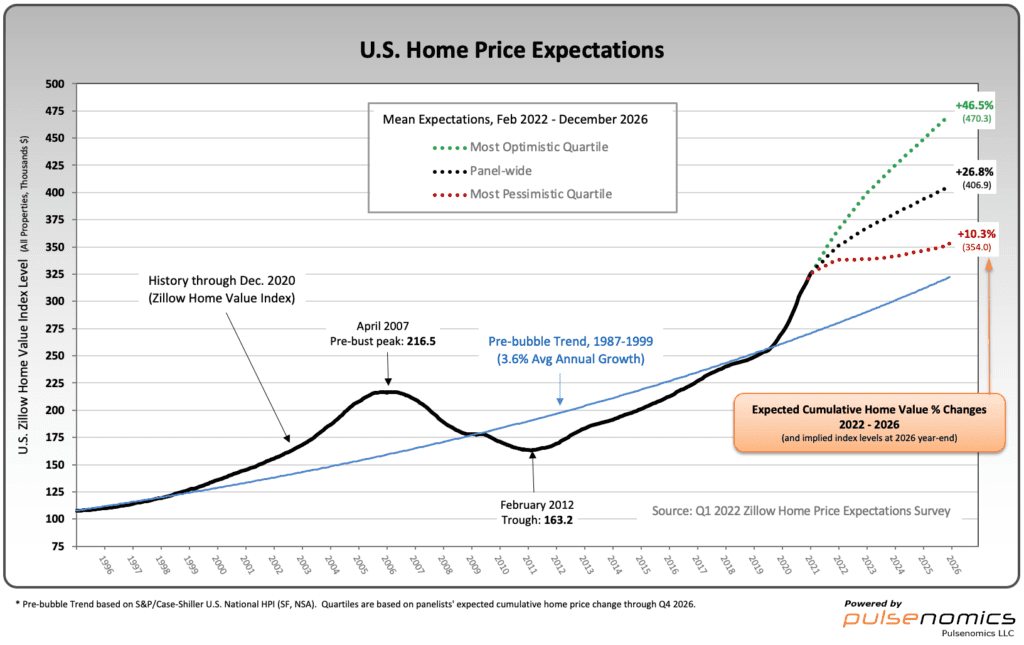
- However, unusual market conditions continue to produce disparate views re: the price path ahead–the spread between those of the most optimistic quartile of experts (green line in below plots) and the least optimistic (red line) is at record-wide levels and illustrates the lack of consensus.
The number of U.S. housing market stakeholders is enormous; individual stakes are typically very large and have practical, economic, and emotional dimensions.
- The aggregate capital value of U.S. housing presently exceeds $42 trillion. Residential real estate is by far the largest asset for most homeowners; prevailing home equity levels and expected home value changes can have a significant impact on consumer spending behavior.
- Consider the household wealth effects and broader economic implications of the alternative price paths depicted in the above plots. The mean 5-year cumulative forecast from the optimistic quartile of experts (+46.5%) translates to $62.1 trillion in aggregate U.S. home value in 5 years—$15.3 trillion more than the $46.8 trillion implied by the mean forecast (10.3%) from the least optimistic quartile.
- For many homeowners, their house is not only a shelter and store of wealth, but a source of family esteem and civic pride. For millions of renters, attaining homeowner status remains a hallmark of achieving “The American Dreamâ€.
Housing is a key driver of the U.S. economy, and millions of private-sector jobs are directly or indirectly tied to the U.S. housing market throughout the construction, manufacturing, retail trade, financial and other service industries.
- Housing contributes significantly to U.S. GDP through private residential investment (i.e., construction of single-family and multifamily structures, manufactured home production, residential remodeling, real estate broker fees) and consumption spending on housing services (i.e., gross rents and utilities paid by renter households, and homeowners’ imputed rents and utility payments).
Governments and private financial institutions around the world are exposed to U.S. home price risk via their collective multitrillion-dollar exposure to mortgage and home equity securities.
- The U.S. federal government is the single largest stakeholder in the housing market, and its stake has grown significantly since the housing bust and financial crisis more than a decade ago.
- Considering the foregoing, U.S. taxpayers–regardless of their housing tenure and location–have an indirect but tangible stake in the future health of housing markets across the U.S.
- The impact of the Covid-19 pandemic on housing fundamentals will play out over many years and compound the lingering volatility left in the long wake of the historic U.S. housing bust.
The complete list of our latest Crystal Ball Award Winners and Top-10 rankings are available here.