What a Difference a Year Makes… in the Outlook for U.S. Home Prices
What a difference a year makes in the outlook for U.S. home prices. Here are some observations from data collected in the Q1 2023 edition of the Pulsenomics Home Price Expectations Survey:
- More than two-thirds of the 107 experts who responded expect home values to fall this year–up from just 7% of panel respondents in our Q1 2022 survey, and up from just over one-half of experts in our prior (Q4 2022) survey. This is the highest percentage of forecasters calling for an outright annual decline since the depths of the housing bust more than a decade ago.
- In real (inflation-adjusted) terms, expectations for nationwide home values are now the lowest ever recorded in the 14-year history of this survey.
- Nationwide, nominal single-family home prices are now expected to fall an average of 2% in 2023; one year ago–before the epic interest spike–they were projected to rise 4.7%.
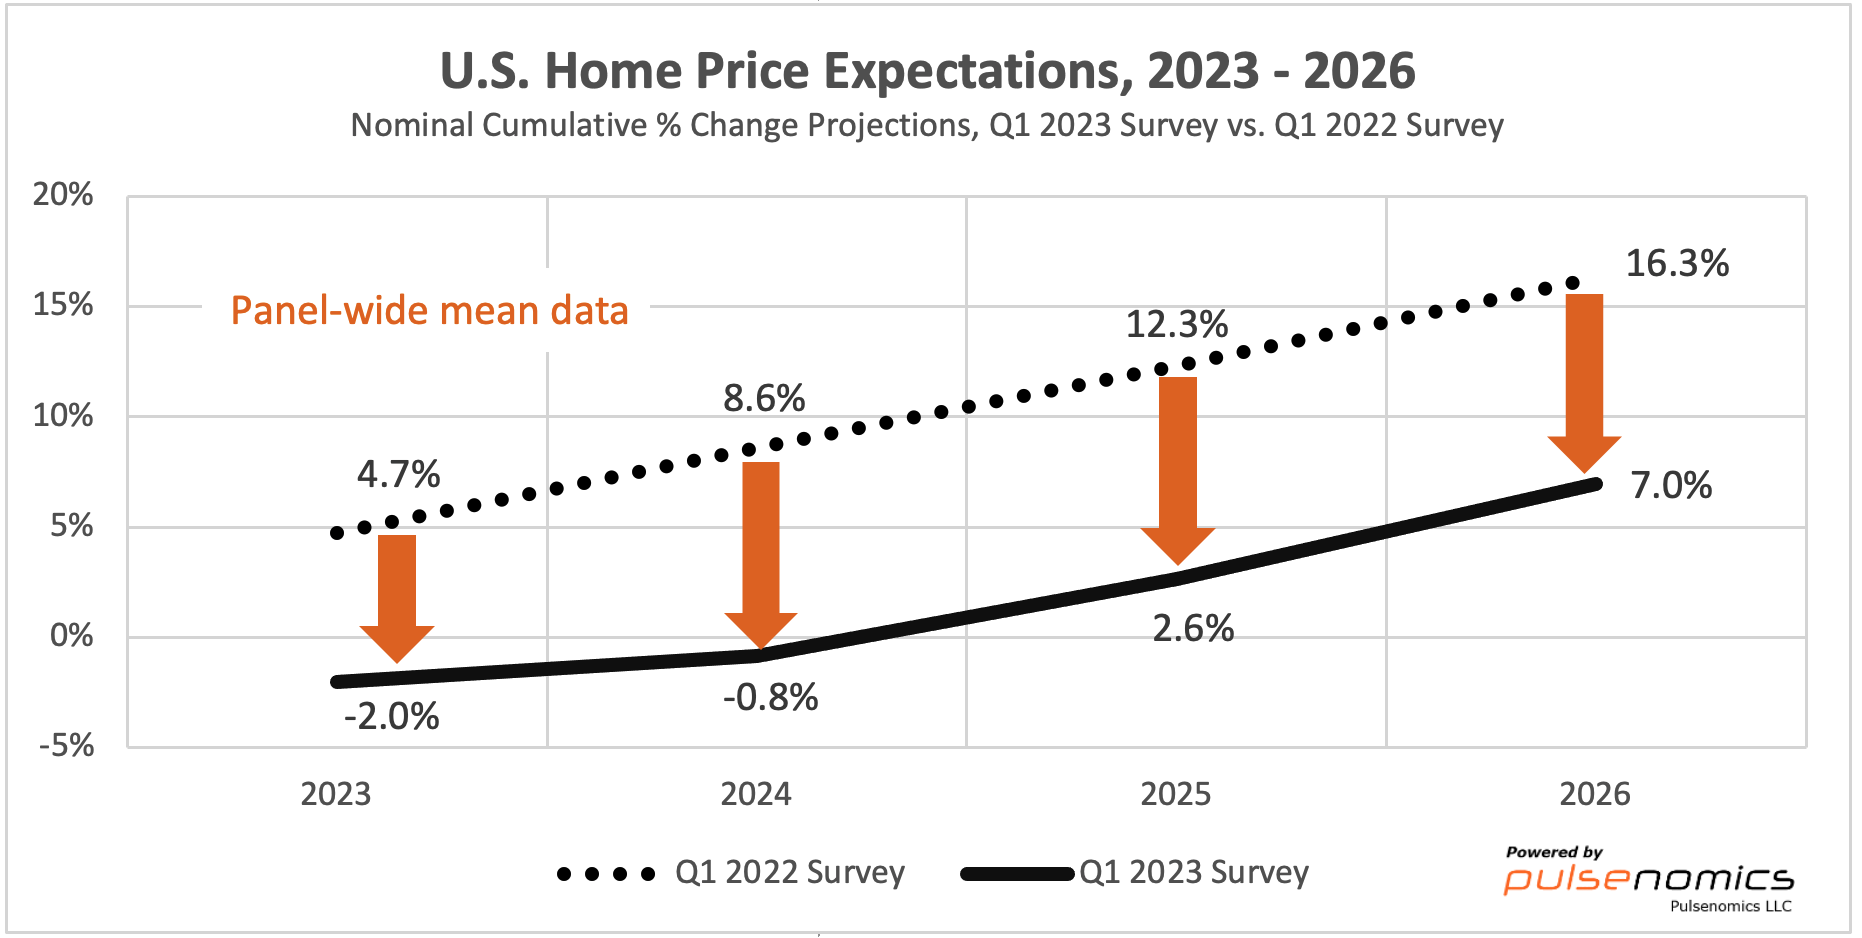
This shift in the panel’s mean projections suggests that compared to one year ago, aggregate U.S. single-family home values are now projected to be more than $3 trillion lower at the end of 2023
(2022 Aggregate U.S. SF Home Value = $47.9Trillion per the December 2022 Fed Flow of Funds Report, Table B.101).
- The overarching home price outlook for 2023 is downbeat, but not depressed (e.g., only a handful of experts are calling for a double-digit depreciation rate this year). The past year’s rate spike intensified an acute shortage of inventory via the mortgage lock-in effect, and fortified the floor for home prices.
- With such unusual market dynamics, it’s unsurprising that the dispersion of expectations among our panelists remains elevated: the five-year forecasts of the optimistic quartile of the experts imply that aggregate U.S. home values will grow to $60.9 trillion from $47.9 trillion by the end of 2027 (cumulative nominal growth of 27.1%), while the five-year projections of the pessimistic quartile imply home values will fall to $47.0 trillion (cumulative nominal negative growth of -1.8%).
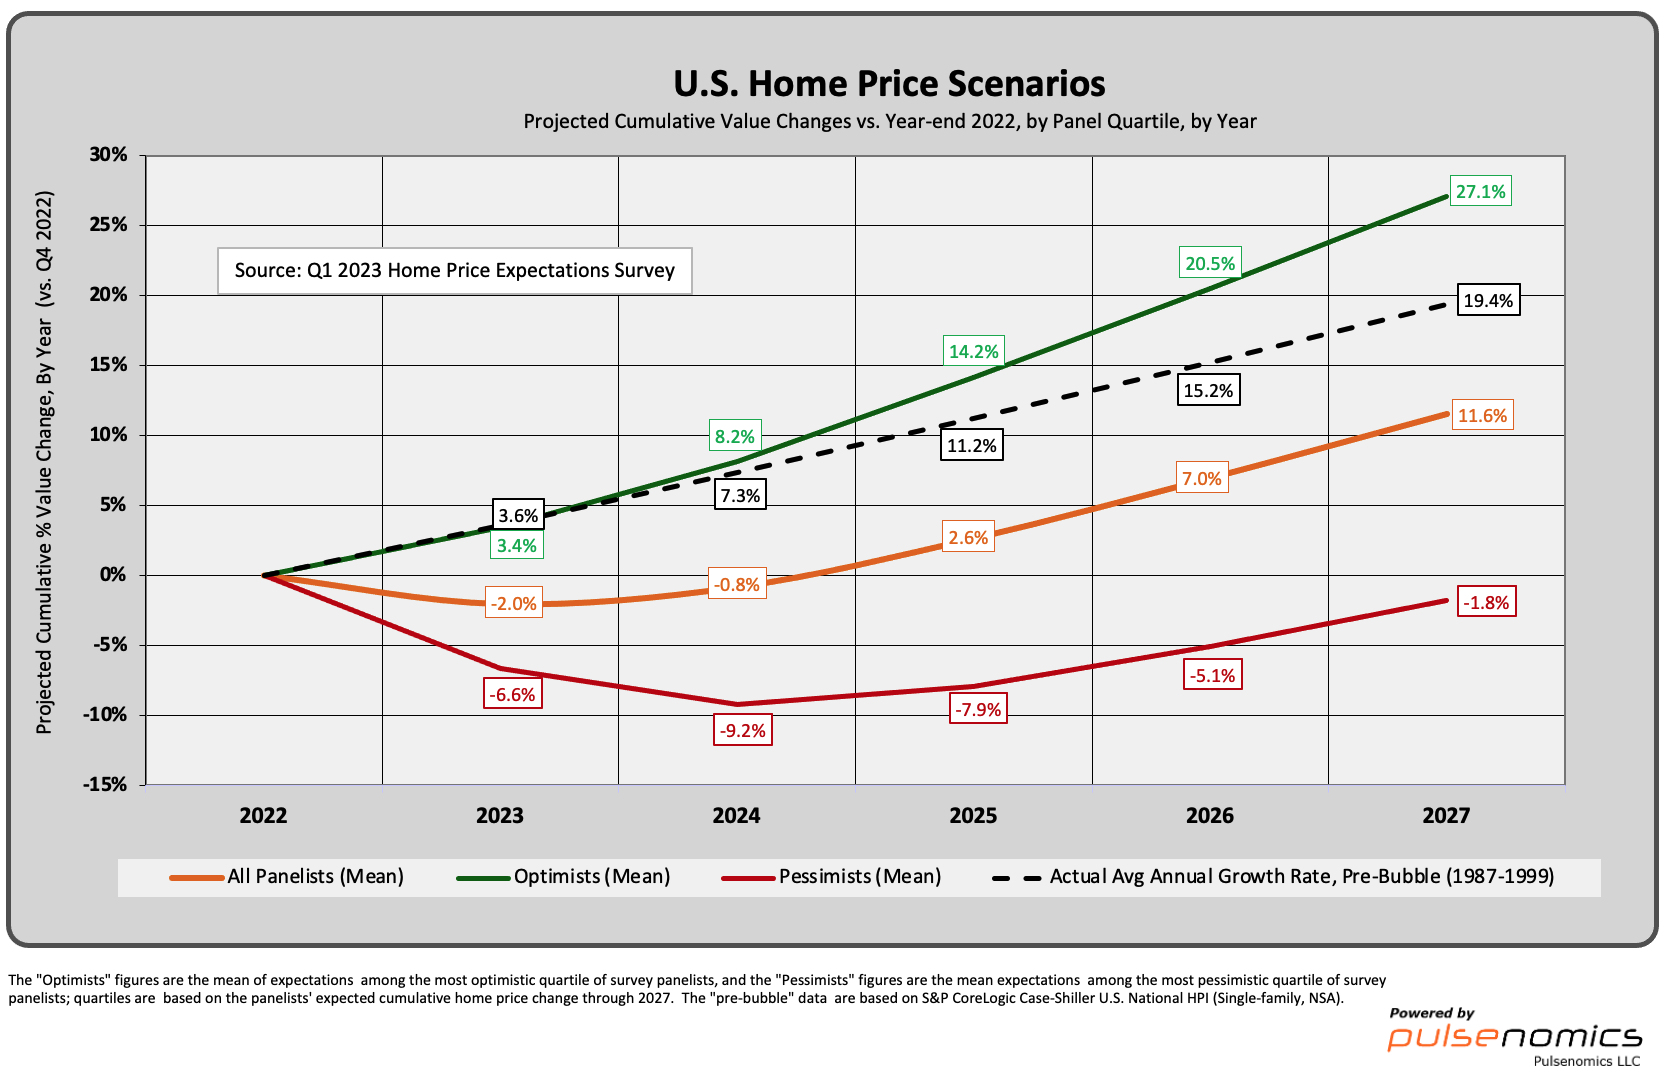
- The forecasts of the optimistic and pessimistic quartiles imply a nearly $14 trillion variance in aggregate U.S. household wealth by the end of 2027. The distinct but equally plausible home price paths would produce starkly contrasting degrees of consumer confidence, levels of household spending, and overall macroeconomic health. These alternative housing scenarios are another illustration of the elevated risk management and policymaking challenges of our time.