Downside Risk Signals in US Housing
According to the Q4 2018 edition of the Zillow Home Price Expectations Survey released yesterday, U.S. home prices are projected to increase at an average 3.8 percent rate in 2019–down from an expected 4.2 percent a few months ago. (These data are based upon responses from 114 members of an expert panel managed by Pulsenomics).
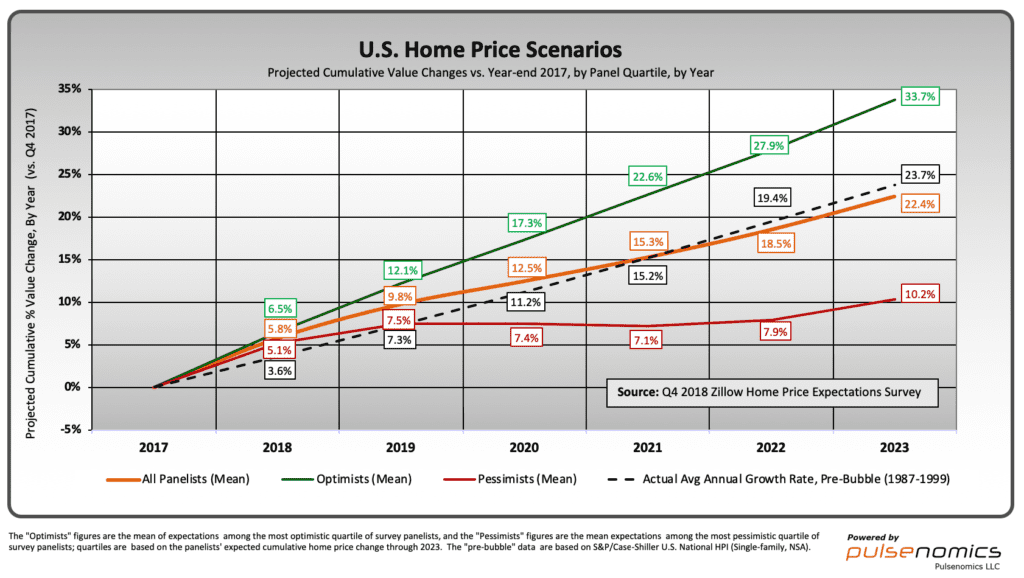
The panel’s longer-term home price expectations have crept lower. For the five years ending December 2023, the average expected annual rate of U.S. home price appreciation is 3 percent. If this relatively modest growth pace materializes, it will be about one-half the nearly 6 percent average yearly clip recorded since the onset of the housing recovery almost seven years ago.
In isolation, this projected dip is not especially troubling. Adjusting 3 percent (nominal) expected property appreciation for expected inflation (2.1 percent per year over the coming five years, according to The Cleveland Fed) yields a normal real rate of return on U.S. housing assets: 1 percent-or-so. (One percent inflation-adjusted annual price growth is typical of a normally-functioning U.S. housing market, e.g., the decade-plus period that preceded the onset of the historic housing bubble).
Other survey indicators are signaling higher risk and thus warrant greater concern. First, the difference between the expectations of housing optimists and pessimists has widened compared to last quarter and one year ago. In dollar terms, the difference amounts to $6.5 trillion in U.S. home equity value through 2023.
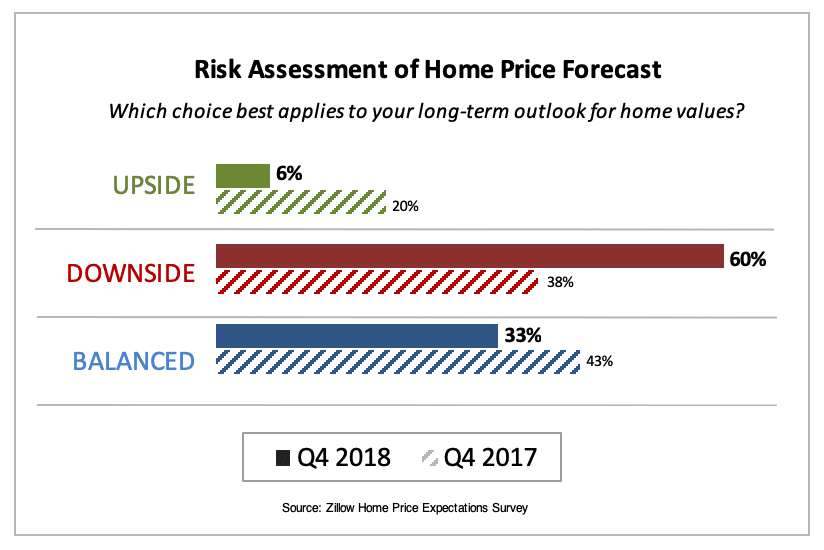
Second, sixty percent of panel members now say there is downside risk to their long-term home price projections, while only a handful of the more than one hundred experts say there’s upside.
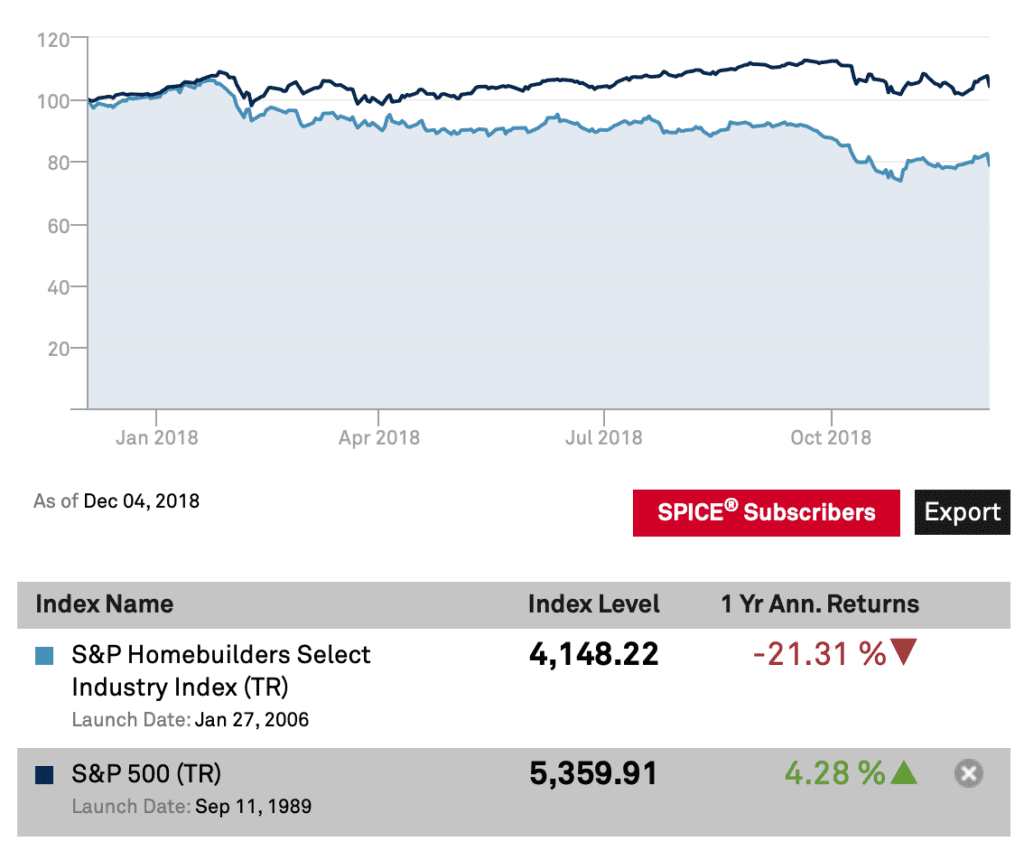
Third, stock prices of publicly-traded home builders, already down more than 20% for the year, reflect a shaken sector and negative sentiment. The group took another hit yesterday, as high-end homebuilder Toll Brothers reported a sales slowdown and opted not to provide earnings guidance for its next fiscal year. During a call with analysts, its CFO stated, “These current market conditions create a range of possible scenarios for our full-year results.”
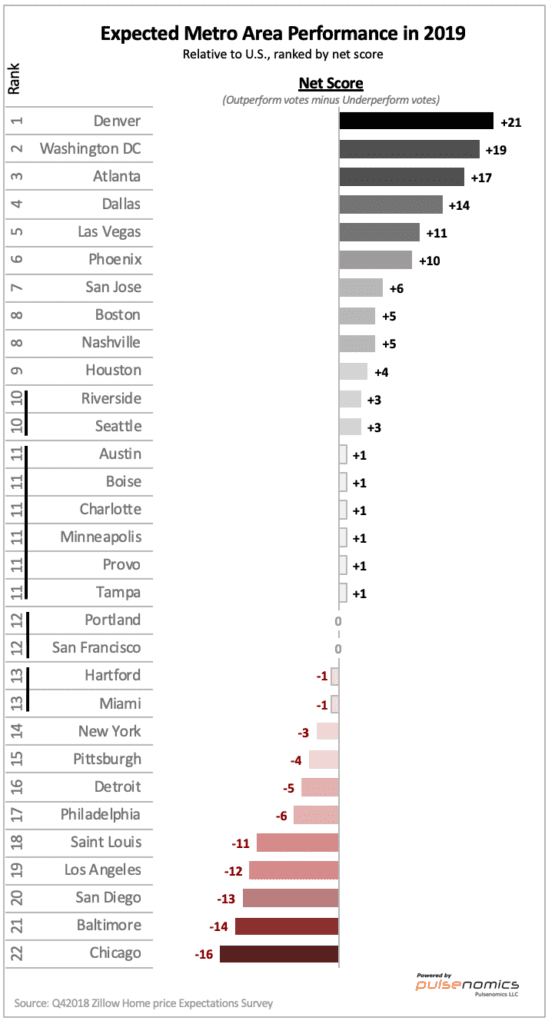
Much like the price performance of individual stocks differ relative to the reliable equity indices that serve as barometers of broader prevailing market conditions and expectations, real estate market dynamics are unique at local levels, and the degree of downside price risk faced by property stakeholders can be significantly lower or higher than that forecasted for residential real estate nationwide. The graphic below summarizes those metro areas that the expert panel considers most likely to out-perform and under-perform the national average home price appreciation rate in 2019.