100+ Forecasts for U.S. Home Prices & Rents
Last week, Zillow announced the results of the latest Home Price Expectations Survey conducted by Pulsenomics. In addition to updating their projections for nationwide home prices through 2026, our expert panelists shared their outlook concerning how U.S. house values will change relative to residential rent prices, stock prices, and headline CPI inflation. First, let’s take a look at how the experts see residential real estate prices unfolding in the coming years in the U.S..
Home Prices vs. Rent Prices
Takeaways:
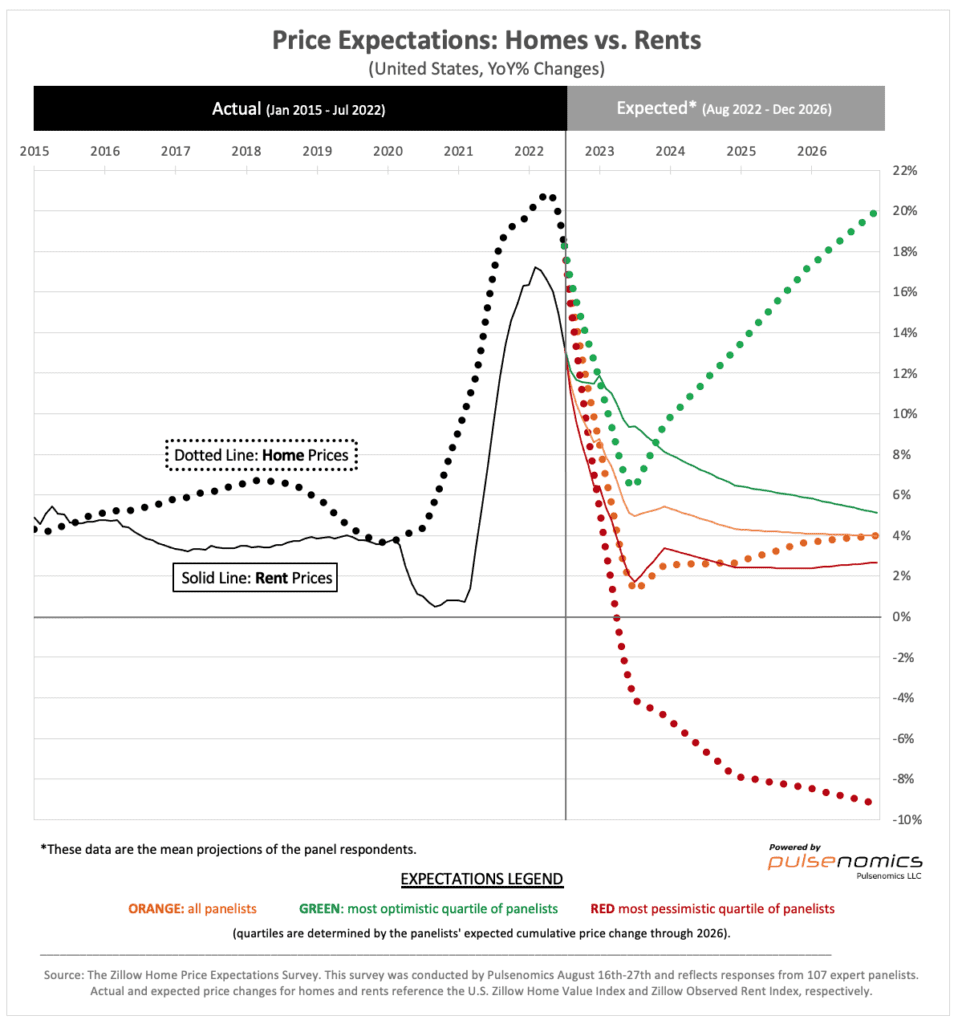
- Most experts expect the rate of annual nationwide rent increases to gradually diminish through at least 2026 and outpace home value gains over the same time horizon (see orange lines in above chart).
- If the average of panel-wide price projections prove accurate, gains in both home prices and residential rents will converge at a 4% annual rate by 2026.
- The mean of all panelists’ rent forecasts also suggests that the sub-four percent annual increases that were common before 2021–and that contributed to years of tame headline inflation numbers–will not return until 2027 at the earliest.
- None of the 107 expert survey respondents expect 2023 U.S. home price gains to exceed those of 2022, and just over one-fifth (21%) of them are forecasting negative (nominal) nationwide home price growth for next year. However, more than two-thirds (67%) of all panelists assigned downside risk to their current forecast, and after adjusting for expected inflation in the broader economy, the mean of panel-wide projections implies that U.S. housing will deliver negative real returns now through 2024.
- A comparison of expectations of the most optimistic and most pessimistic expert groups reveals that forecast dispersion for home prices remains very high. This is reflected in the opposite trajectory and widening spread after this year between the dotted green and red lines. Bear in mind that this is not a household survey of random, anonymous respondents–such significant differences in the views of our well-informed subject matter experts are symptomatic of a market unsettled by a confluence of unfamiliar yet powerful forces.
-
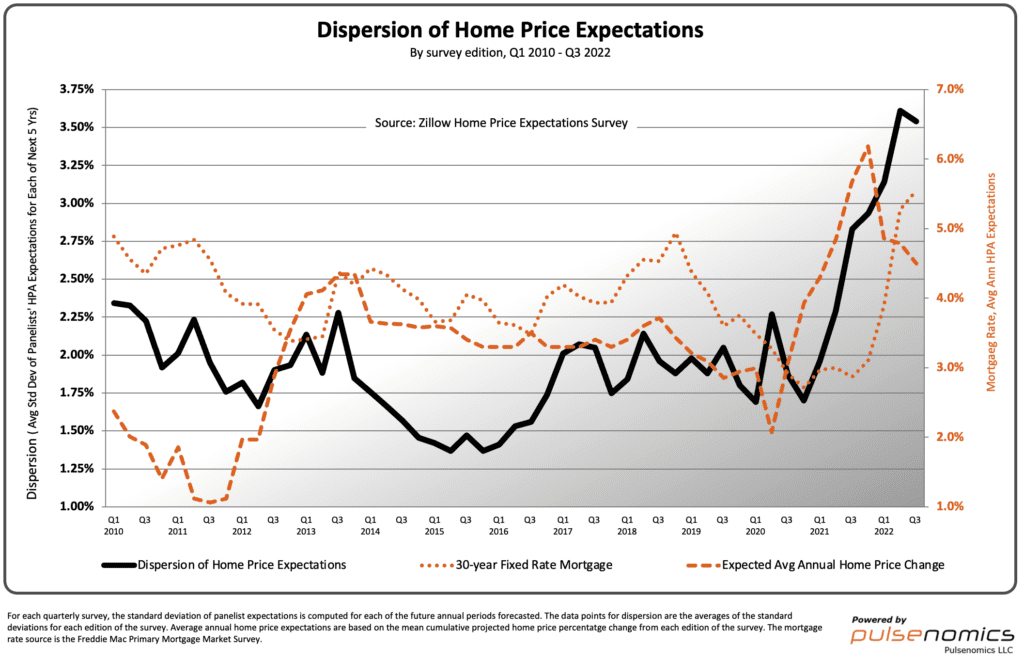
- The dispersion of panelist home price projections spiked at the onset of the pandemic and surged thereafter, reaching a 12-year record high in our previous (Q2 2022) survey before ticking down slightly in this (Q3) survey–see below chart (note: mortgage rates have ramped up nearly 150 basis points since late August, when the field period for this latest survey ended).
-
- The degree and persistence of this dispersion signals elevated risk for stakeholders in U.S. housing, a huge ($45 trillion) but illiquid asset class.
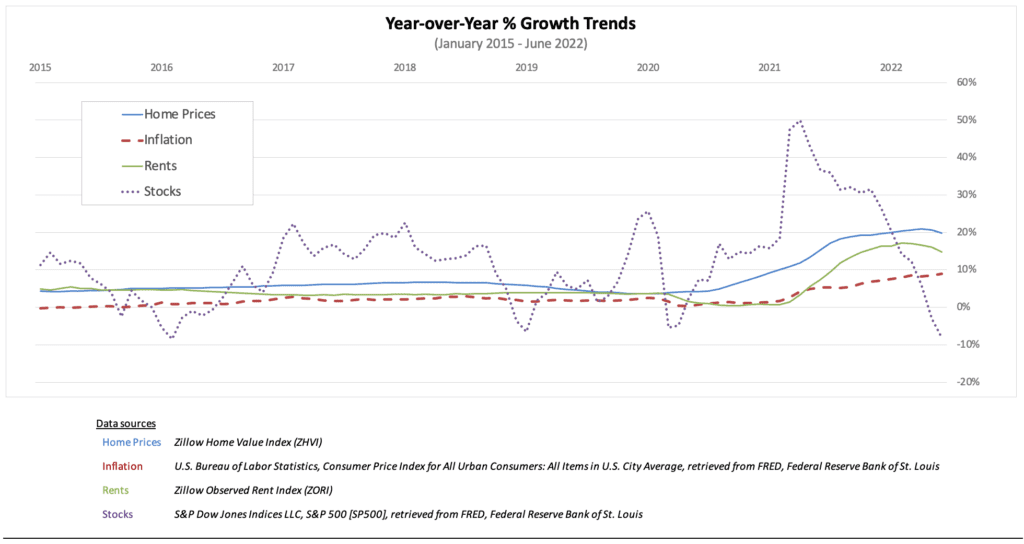
Now, let’s turn to our panel’s expectations regarding residential real estate prices in the U.S. relative to stock prices and headline inflation. Here is a chart of recent YoY% changes for pertinent indicators:
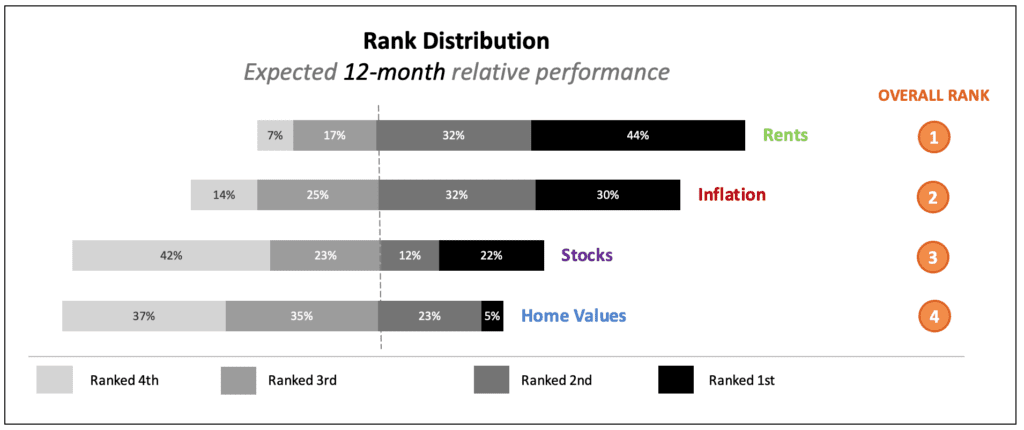
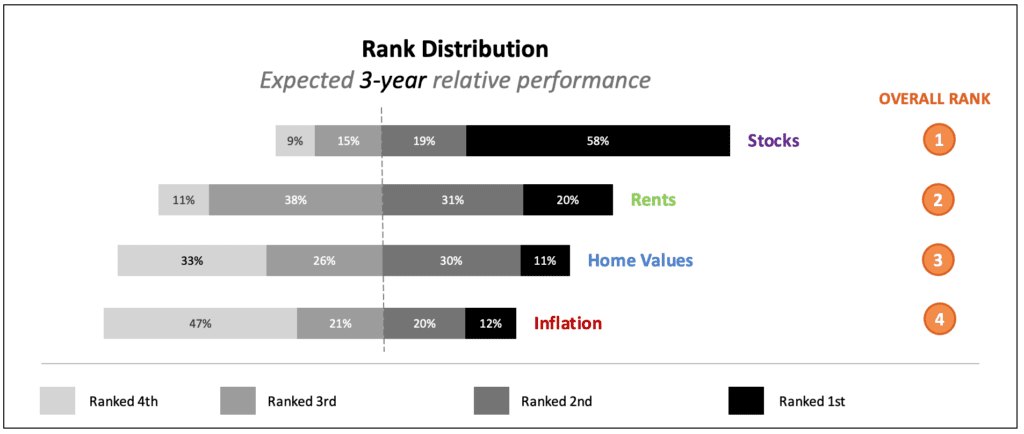
We asked members of our expert panel to rank each of the four indicators above from highest to lowest according to the growth rate expected over (a) the coming 12 months and (b) the coming three years. The charts below display the rank distributions for each time horizon.
These data are consistent with a view that U.S. supply chain challenges will diminish in the coming years, but sticky and lagging residential rent prices may create a speed bump in the Fed’s timeline for hitting its inflation target.